Hydra
Julian Rakuschek - 2023-03-01 - Klinikum Klagenfurt am Wörthersee
Nessus
Flask
Svelte
Visualization
The local hospital in Klagenfurt requires a strong cybersecurity instance. Since managing thousands of computers by hand is tedious, they employ a service called "Nessus" which is an automatic scanner that searches for vulnerabilities in systems. However, the data produced by the nessus scanner needs to be presented in a way such that it can be easily understood by the management department. This was one of the main tasks of the Hydra project. In addition, the Hydra project incorporates lots of different utility tools for the security adviser such that it becomes easier to maintain strong security for thousands of computers.
Hydra is a web application which utilized the following technologies:
- Flask (python) in the backend
- Svelte in the frontend
- MySQL as the database with SQLAlchemy as the ORM.
- Chart.js for the plots
- Redis as a fast key-value store for caching and communication between services.
Disclaimer: All data records have been artificially generated such that no actual vulnerability records of hosts are shown. For vulnerabilities, some random nicknames have been chosen and for hosts, the largest cities of the world are used.
One of the main goals of the project was to simplify the workflow as much as possible. Hydra is able to automatically check for completed nessus scans and allows the user to select which scans shall be imported upon confirmation. The result looks as follows:
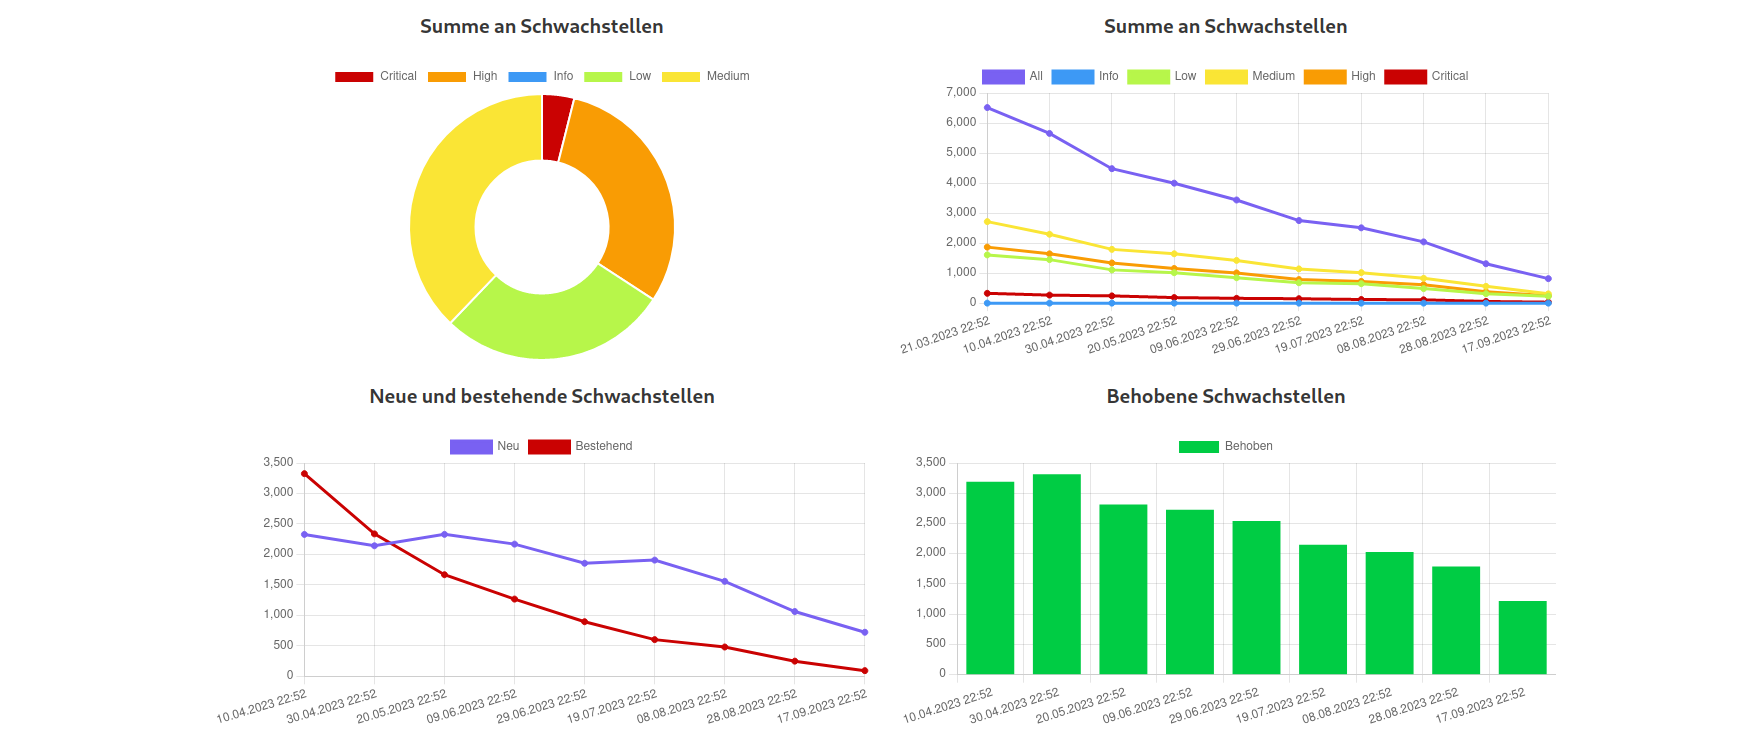
The user can immediately see the severity distribution via a doughnut chart. On the right one can see a lineplot showing the number of vulnerabilities over time, divided into severity groups. In the ideal case, as shown in the image, these numbers should decrease. The bottom plots show the number of already existing, new and fixed vulnerabilities over time. These are calculated by tracking the pluginID (essentially the ID for a vulnerability in nessus) over different scans for each host in order to see if they disappear. In addition, the user can also see the top vulnerabilities/hosts:
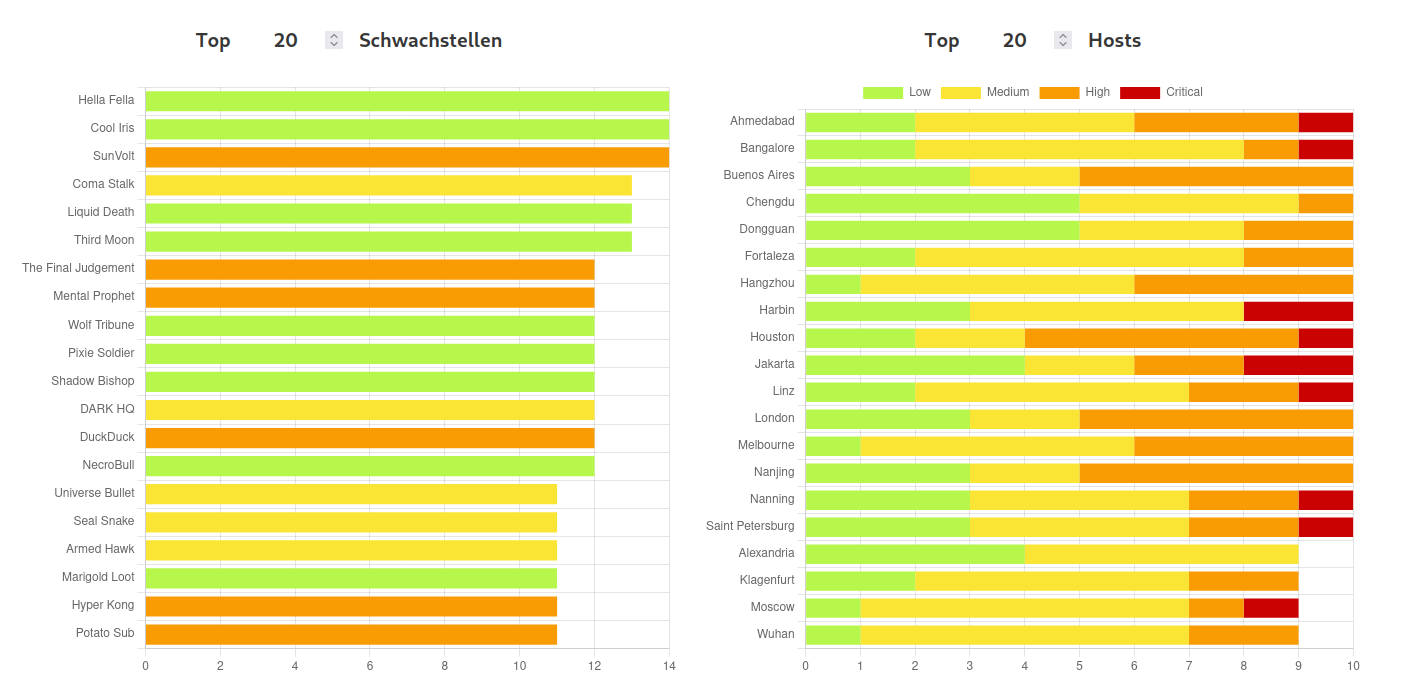
Of course one might want to see all vulnerabilities of a host in a table. Therefore, if one clicks on the host in the charts shown in the image above, the user is navigated to a table with all vulnerabilities:
In the real world, vulnerabilities often have very similar names due to the version of the software product being included in the name. By using a technique from natural language processing called BERTopic we can cluster vulnerabilities and get an impression of this phenomenon:
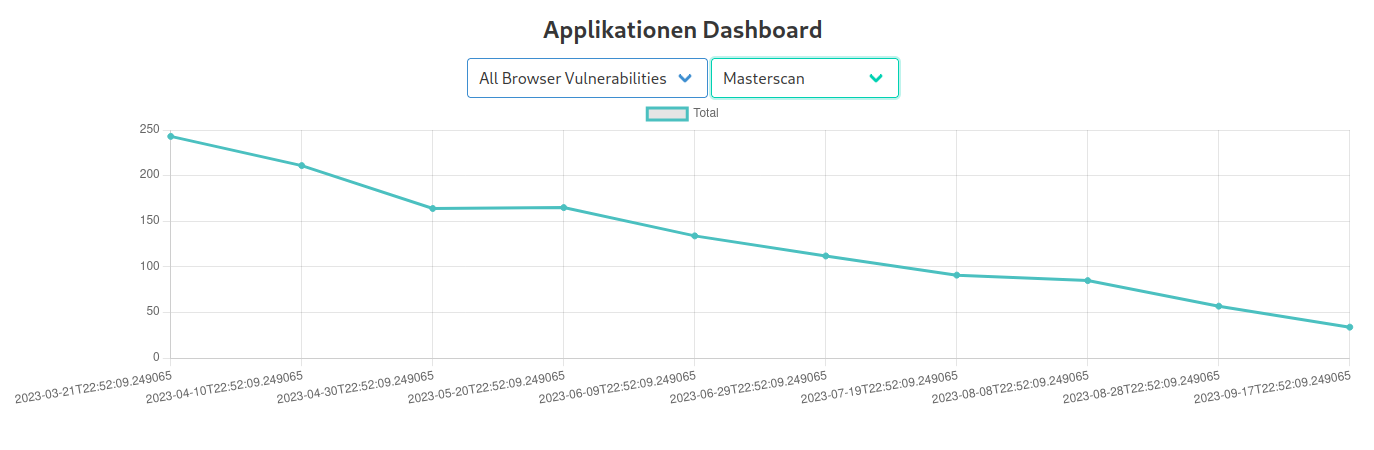
Therefore, it makes sense to group vulnerabilities together, for example one might want to group all vulnerabilities whose names start with "Chrome" or "Firefox" together. This is called a vulnerability group, one might name the above examples "Browsers". Clustering is an essential feature of the vulnerabilities table which required an efficient and nifty algorithm in order to maintain the paging feature. But this is not the only use case for the vulnerability groups, one can also combine vulnerability groups to create a very flexible filter for vulnerabilities. Subsequently shown, one can now track all Vulnerabilities of a specific group over time:
However, it does not stop here, the Hydra project was designed as a utility tool for the security adviser, and thus it features many more tools besides nessus scan visualization as shown below:
Most of these tools are much smaller than the Nessus visualization tool and the most common task is to import data, present it as a pretty table and create line charts for specific data features. It is tedious to perform all these tasks in the SQL Terminal or always export a CSV table and subsequently process it in Excel. Therefore, cron jobs are used in order to automatically import all these different data sources into one centralized database and thus allow the user to quickly gain insight without the additional overhead.